

Little Kanawha River Watershed Dynamics Project
Research Group
Each class sent representatives into the field to collect data from several sites along the Little Kanawha River. The day long field trip collects data from several locations: the headwaters at Falls Mills, below the dam at Burnsville, Sand Fork, and Glenville.
Designed by Adam and his fellow science faculty at Gilmer County High School (GCHS), the Little Kanawha River Watershed Dynamics Project allows students from all science disciplines in the school (e.g. Biology, Chemistry, Environmental Technology, and Physics) to evaluate the overall health of the Little Kanawha River based on collected, shared, and research data. At the end of the project, each class presents its evaluation of the health of the river.
Since Adam teaches chemistry and physics at GCHS, he has two classes participating in this project. Each science class looks at the health of the river from that discipline’s perspective. Chemistry looks at the chemical makeup of the river such as pH, dissolved oxygen, and other solute concentrations, and physics examines the volume of water flowing. Each class collects data from multiple points along the river starting at the headwaters and ending at Glenville. The culminating event is a multimedia presentation of the students’ assessment of the health of the river.
Using multiple technology tools to conduct an investigation of the health of the local river, chemistry students synthesize information from several science disciplines, compare quantitative and qualitative pH data, and examine the concentrations of solutes in the river. Physics students will synthesize information from several science disciplines and predict the flow and discharge of river water at several sites.

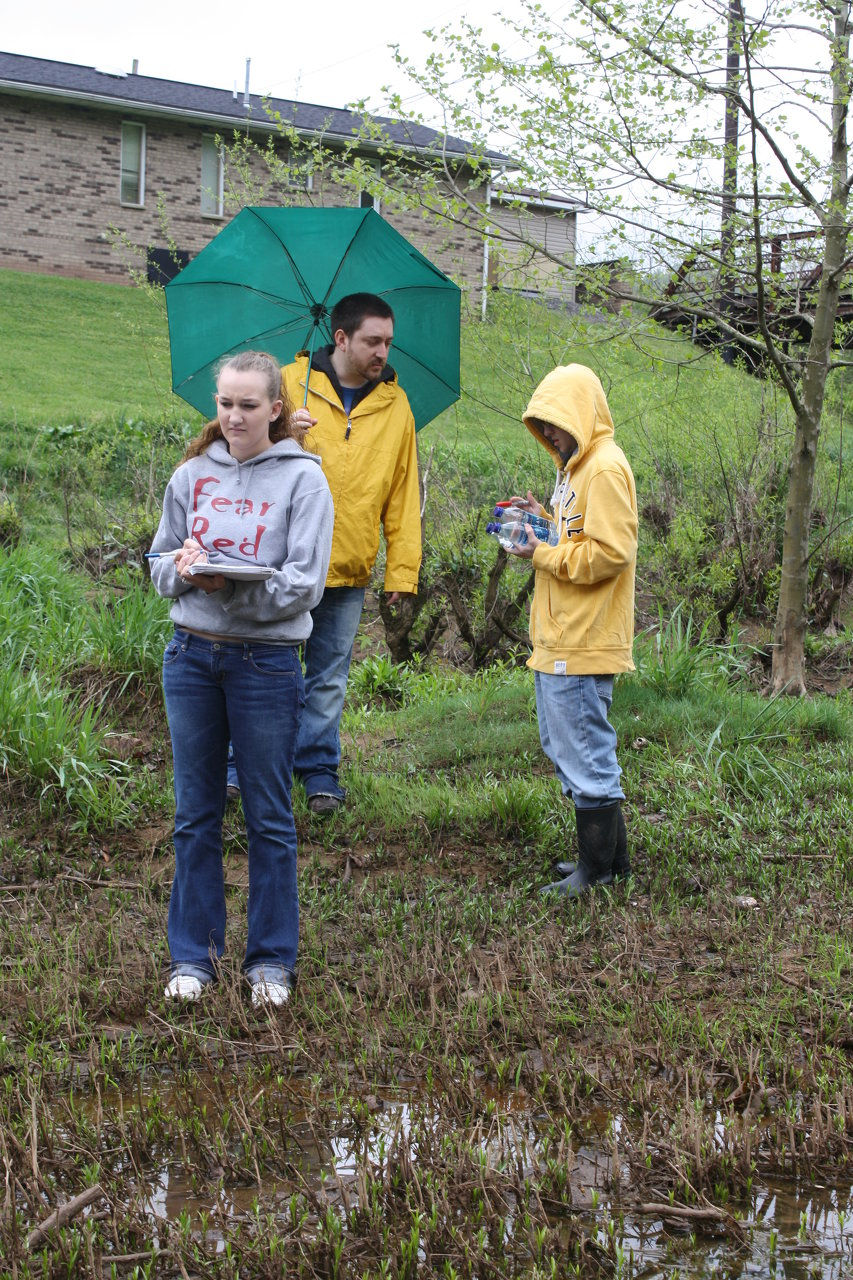
Water Samples
Water is collected from each site and brought back to the classroom. This gives students who did not go on the field trip a chance to run tests and collect data on their own in addition to the data collected on the trip.
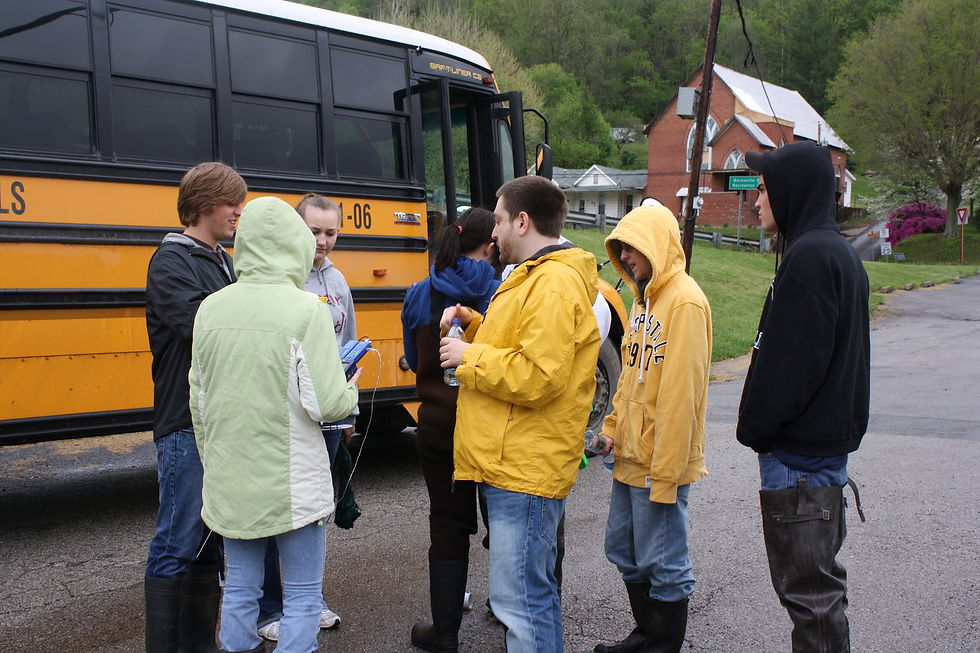
Organize
At every data collection site, a group meeting is held to plan how to collect data at that site. Important safety information is discussed as each site has a unique terrain.
Recording Data
Besides water samples, a site description is taken at each site, and any data collected is also recorded. This data is analyzed in the classroom by all the students.
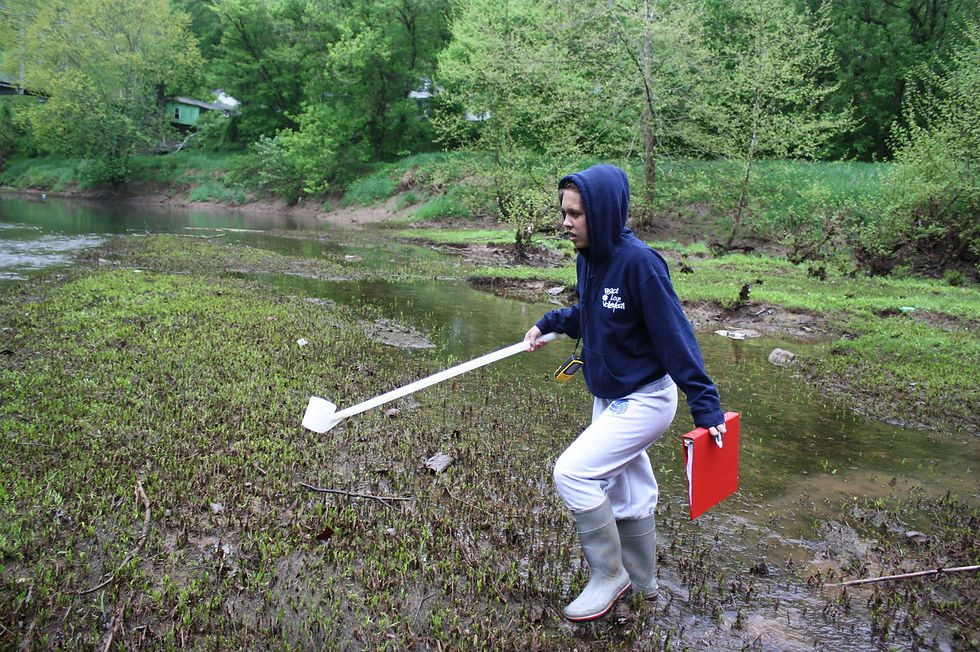
Water Discharge
Students measure the river's width, depth, and speed to calculate the volume of water traveling through that site every second.

PASCO GLX
Students use various technologies, such as the PASCO GLX, to measure the river's temperature, pH, dissolved oxygen concentration, and conductivity.
